![](https://static.wixstatic.com/media/a1dd0a_5c9ec4b463994215ba11a7ecb0e4faa1~mv2.png/v1/fill/w_1752,h_719,al_c,q_90,enc_avif,quality_auto/a1dd0a_5c9ec4b463994215ba11a7ecb0e4faa1~mv2.png)
How It Works
Trading Indicators
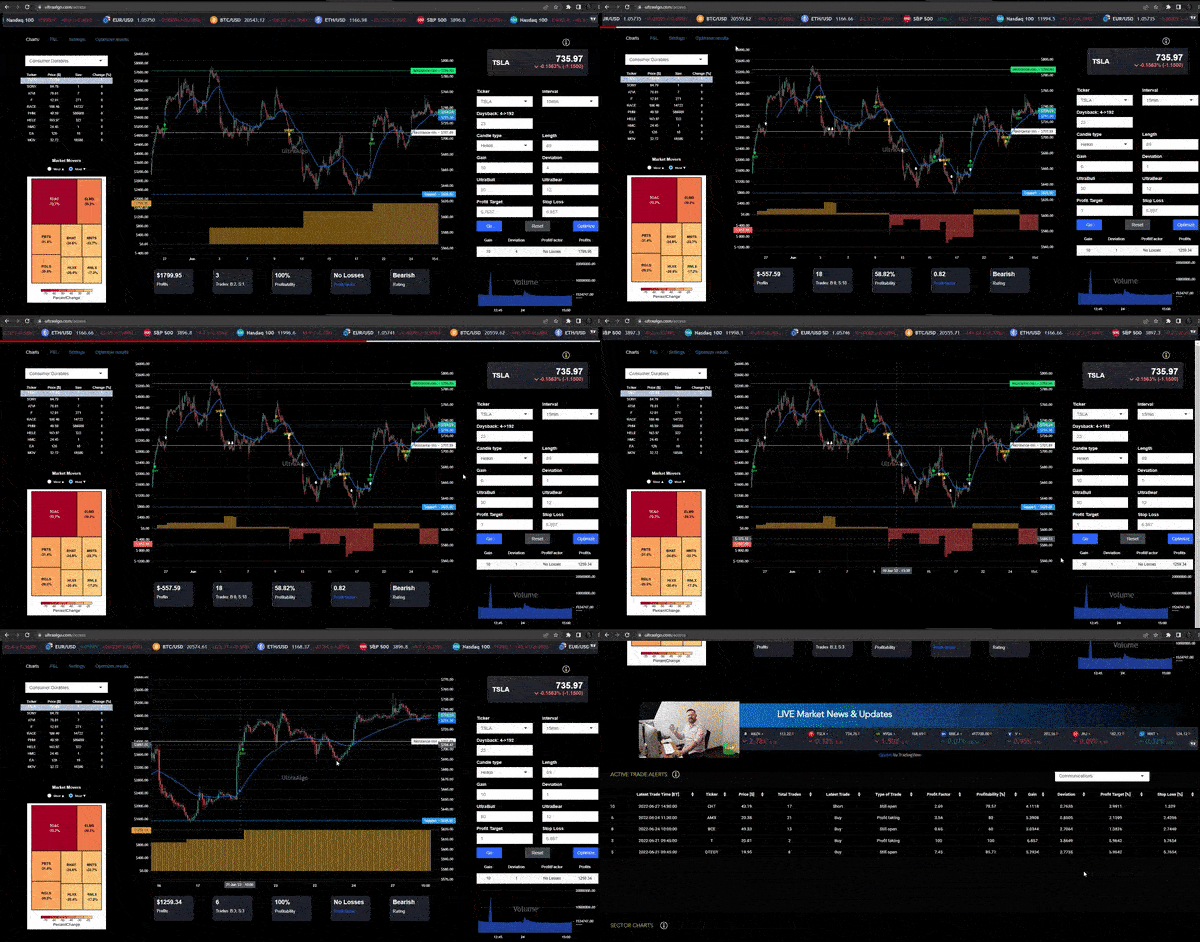
Simplify the Buying or Shorting process by following the signals. Validate the pattern and control risk by leveraging our easy-to-follow backtesting. Understand opportunities for consistent returns, then leverage the signals for timely execution.
![Platfrom_Trading.png](https://static.wixstatic.com/media/a1dd0a_82d08d02650b4da28764423ba39f0ed0~mv2.png/v1/fill/w_440,h_369,al_c,q_85,usm_0.66_1.00_0.01,enc_avif,quality_auto/Platfrom_Trading.png)
![Settings.png](https://static.wixstatic.com/media/a1dd0a_11de40bb141344fea61fb4a1f5f675ae~mv2.png/v1/crop/x_1,y_106,w_398,h_503/fill/w_291,h_370,al_c,q_85,usm_0.66_1.00_0.01,enc_avif,quality_auto/Settings.png)
![PF.png](https://static.wixstatic.com/media/a1dd0a_99e11284103c4493b9c0de20f1a9028b~mv2.png/v1/crop/x_15,y_20,w_140,h_90/fill/w_196,h_123,al_c,lg_1,q_85,enc_avif,quality_auto/PF.png)
Best Stock Settings
Our platform was designed for speed. It runs algorithms that also allows users to identify the best performing combination of settings at the click of a button in seconds.
Optimization outputs can be tuned either for Profit Factor (percentage of wins) or Profits (realized returns). Have access to the same features that are usually reserved for HFT (High Frequency Traders) by leveraging the power of genetic algorithms.
![Platfrom_Trading.png](https://static.wixstatic.com/media/a1dd0a_82d08d02650b4da28764423ba39f0ed0~mv2.png/v1/crop/x_567,y_32,w_217,h_182/fill/w_276,h_230,al_c,lg_1,q_85,enc_avif,quality_auto/Platfrom_Trading.png)
Support / Resistance Lines
Quickly identify the levels of support and resistance based on historical data. This feature is delivered in real-time across charts, allowing traders to easily identify the greatest opportunities at a moment's notice.
![SA_Backtest.png](https://static.wixstatic.com/media/a1dd0a_c72fad962eec4b4eb73f9bd19b14214e~mv2.png/v1/crop/x_682,y_24,w_345,h_266/fill/w_361,h_278,al_c,lg_1,q_85,enc_avif,quality_auto/SA_Backtest.png)
![SA_Backtest.png](https://static.wixstatic.com/media/a1dd0a_c72fad962eec4b4eb73f9bd19b14214e~mv2.png/v1/crop/x_177,y_69,w_338,h_338/fill/w_291,h_291,al_c,q_85,usm_0.66_1.00_0.01,enc_avif,quality_auto/SA_Backtest.png)
Brokerage Integration
Execute trades to multiple platforms and track portfolio performance seamlessly. Integrations includes TradeStation, Interactive Brokers, TD Ameritrade and Alpaca. We also offer simulated trading which allows customer to validate strategies prior to execution into live accounts.
Stock Price Trend Lines
We include a variable trend line on the technical chart indicator that tracks the price of an investment (like a stock or commodity) over time. The trend is a type of weighted moving average (WMA) that gives more weighting to recent price data and is based of 15 indicators.
![Brokerage.png](https://static.wixstatic.com/media/a1dd0a_f7d3b39275f5473da92bd702582b4bd0~mv2.png/v1/crop/x_2,y_0,w_228,h_314/fill/w_265,h_365,al_c,lg_1,q_85,enc_avif,quality_auto/Brokerage.png)
Software Requirements
None! Real-Time Trading Data (NYSE / NASDAQ / OTC) included with the subscription.
Installation Video
![Trading Bear.png](https://static.wixstatic.com/media/a1dd0a_13530584b6ad47319f945a31fee9a00a~mv2.png/v1/crop/x_73,y_27,w_427,h_468/fill/w_328,h_360,al_c,q_85,usm_0.66_1.00_0.01,enc_avif,quality_auto/Trading%20Bear.png)